The Infatuation’s EEEEEATSCON, presented by Chase Sapphire®
Gated ticketing platform
We were replacing Eventbrite with a ticketing flow only Chase cardholders could buy from. My first design gated everything behind a Chase access code, and cardholders left before they saw a single ticket. The fix wasn’t a better gate. It was moving it.

Where it got hard
As EEEEEATSCON expanded to new cities, Chase Sapphire and The Infatuation needed a ticketing system only cardholders could buy from. It had to survive launch-day traffic spikes, verify eligibility through Chase’s API, handle tiers, perks, and purchase limits, and explain every failure in plain language.
The tension was simple to state and hard to solve: every layer of security was another reason to leave. The challenge was making an exclusive, secure purchase feel as fast as buying any other ticket.
Why not an off-the-shelf tool?
Off-the-shelf tools sat in the wrong corner, so the gate had to be designed in.

We ran 250 on-site interviews a day with festival attendees, every festival day in every city. I paired them with post-event survey responses and site analytics from every EEEEEATSCON from 2023 through 2025.
- 84% of site visitors arrived on mobile, so the gate had to work one-handed, mid-drop.
- The ticket selector was the most-visited page on the entire site, so whatever happened there decided the sale.
- The access code was the customer service number on the back of any Chase card. Nobody knows that by heart, so the code step had to explain itself.
Who it had to work for


Mapping every path
Three kinds of buyer, one path through the purchase. Before designing a screen, I mapped every step, including each place a code or card could fail.

The decision: show the tickets, then ask for the entry code
Anyone can browse the event and every ticket tier. To check out, cardholders enter an access code: the customer service number printed on the back of any Chase card. The same code unlocks All You Can EEEEEAT tickets, which include early entry. Inline help shows where to find it, and an inline error explains any failure. From there, checkout takes two steps.
I tested it against the code-first gate on the live flow.
Version A: Required a code before showing tickets, but without explaining what it unlocked or where to find it, users hesitated or left, especially after an incorrect attempt.
Version B (shipped): Showed tickets before requesting a code at checkout, helping users understand its purpose and improving completion by 60%.
Billing defaulted to match shipping, removing 9 redundant fields instantly. A sticky order summary kept users anchored to what they were buying. A percentage-based progress indicator replaced "Step 2 of 6" — users moved faster without noticing why.
The problem
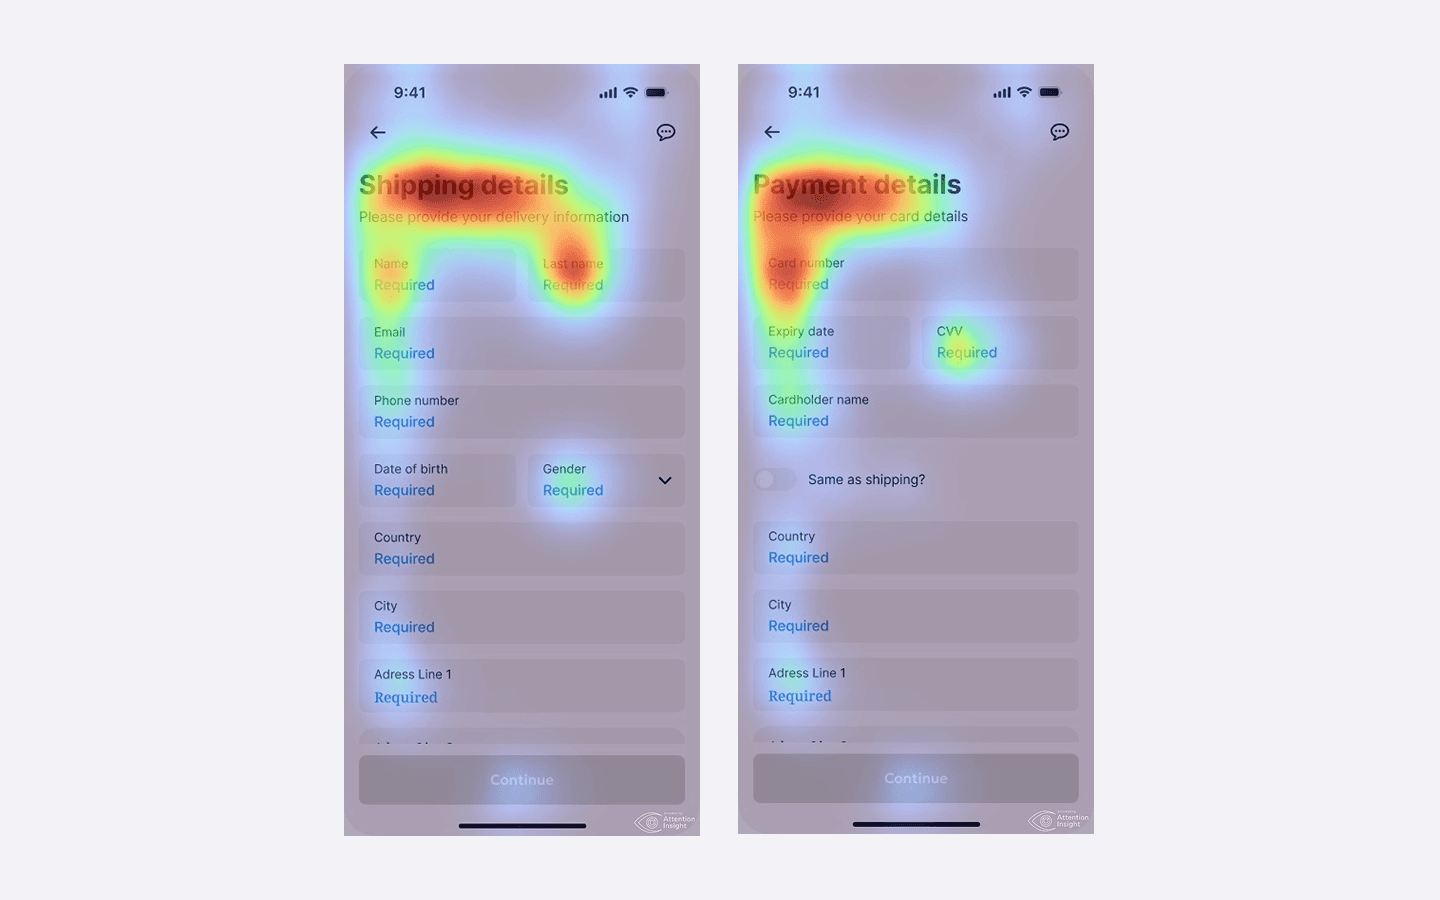
The checkout had grown organically over 3 years. Six steps, 23 form fields, two forced account walls. Users weren't confused — they were exhausted. Session recordings showed a slow bleed across every step, with the sharpest drop-off right after shipping details, when users first saw how many steps remained.


Results
We measured everything before and after. The dashboard wasn't just faster — it changed how advisors worked every day.
Before / After
The checkout had grown organically over 3 years. Six steps, 23 form fields, two forced account walls. Users weren't confused — they were exhausted. Session recordings showed a slow bleed across every step, with the sharpest drop-off right after shipping details, when users first saw how many steps remained.
Before
After
Process
Eight weeks, four phases, one core question: why are people leaving right before they pay? I started by mapping every state of the existing flow, talked to real users who had abandoned checkouts, explored three design directions, and tested them before committing to anything. The result shipped in week 7.
Solution
The core insight was that users couldn't see the end from where they were standing. The fix was architectural — collapse six steps into three, make the order always visible, and move account creation to after purchase.


Billing defaulted to match shipping, removing 9 redundant fields instantly. A sticky order summary kept users anchored to what they were buying. A percentage-based progress indicator replaced "Step 2 of 6" — users moved faster without noticing why.

Billing defaulted to match shipping, removing 9 redundant fields instantly. A sticky order summary kept users anchored to what they were buying. A percentage-based progress indicator replaced "Step 2 of 6" — users moved faster without noticing why.
CEO, Cartly
"The checkout redesign gave us the biggest single conversion lift we've ever seen. Alex just gets it."


Takeaways
Friction is emotional, not just functional
Users weren't dropping off because checkout was hard. They abandoned because it felt long before they even started.
Remove the force, increase the choice
Moving account creation post-purchase didn't just reduce abandonment — it actually increased sign-ups from 11% to 18%.
Visibility is a trust mechanism
A persistent order summary was the highest-ROI single component — one element contributed to nearly half the mobile conversion lift.