Cartly: checkout redesign

Cartly: checkout redesign

Cartly is an e-commerce platform serving 800K monthly shoppers. Despite strong traffic, checkout was quietly losing revenue — users were getting close, then leaving. I was brought in to find out why and fix it.

Main Image of Onboarding in app

CLIENT

Chase + The Infatuation

MY ROLE

Lead Product Designer

Research, flow strategy, UI, prototyping, delivery

TEAM

Product, Engineering

Chase and Infatuation stakeholders

TIMELINE

4 months

To launch, plus iterations across city rollouts

CLIENT

Chase + The Infatuation

MY ROLE

Lead Product Designer

Research, flow strategy, UI, prototyping, delivery

TEAM

Product, Engineering

Chase and Infatuation stakeholders

TIMELINE

4 months

To launch, plus iterations across city rollouts

ROLE

Product Designer

TIMELINE

12

Weeks

TEAM

8 Person

OUTCOME

+34%

Conversion

ROLE

Product Designer

TIMELINE

12

Weeks

TEAM

8 Person

OUTCOME

+34%

Conversion

Visit siteDigital playbook

The full festival journey, from first visit to post-event survey.

Visit siteDigital playbook

64 pages mapping the festival from first visit to post-event survey.

68%

of users dropped off before payment step

68%

of users dropped off before payment step

6

checkout steps — industry average is 3

6

checkout steps — industry average is 3

23

form fields, many 
redundant

23

form fields, many 
redundant

68%

of users dropped off before payment step

68%

of users dropped off before payment step

6

checkout steps — industry average is 3

6

checkout steps — industry average is 3

23

form fields, many 
redundant

23

form fields, many 
redundant

00

Add fourth metric

00

Add fourth metric

Main Image of Onboarding in app

The problem

The checkout had grown organically over 3 years. Six steps, 23 form fields, two forced account walls. Users weren't confused — they were exhausted. Session recordings showed a slow bleed across every step, with the sharpest drop-off right after shipping details, when users first saw how many steps remained.
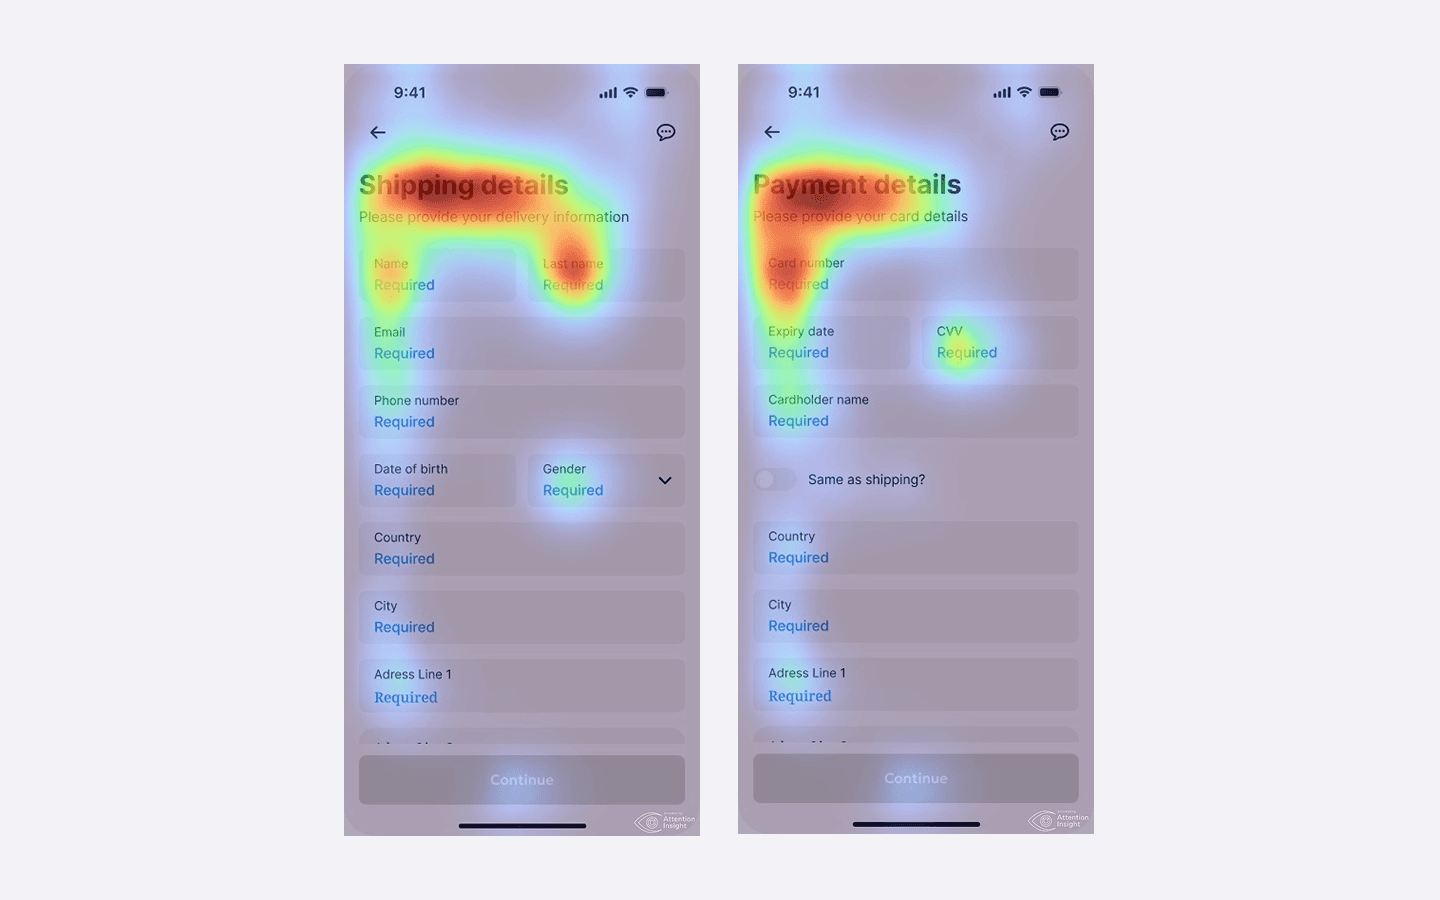
Heatmaps of old app

68%

of users dropped off before payment step

68%

of users dropped off before payment step

6

checkout steps — industry average is 3

6

checkout steps — industry average is 3

23

form fields, many 
redundant

23

form fields, many 
redundant

Process

Eight weeks, four phases, one core question: why are people leaving right before they pay? I started by mapping every state of the existing flow, talked to real users who had abandoned checkouts, explored three design directions, and tested them before committing to anything. The result shipped in week 7.

Persona 1
Persona 1
Add this persona’s goals, needs, and pain points.
Persona 2
Persona 2
Add this persona’s goals, needs, and pain points.
Persona 3
Persona 3
Add this persona’s goals, needs, and pain points.

Personas

Four audience profiles. Replace the placeholder portraits and text with each persona’s goals, needs, and pain points.

Persona 1

Placeholder portrait for persona 1

Add this persona’s goals, needs, and pain points.

Persona 2

Placeholder portrait for persona 2

Add this persona’s goals, needs, and pain points.

Persona 3

Placeholder portrait for persona 3

Add this persona’s goals, needs, and pain points.

Persona 4

Placeholder portrait for persona 4

Add this persona’s goals, needs, and pain points.

68%

of users dropped off before payment step

68%

of users dropped off before payment step

6

checkout steps — industry average is 3

6

checkout steps — industry average is 3

23

form fields, many 
redundant

23

form fields, many 
redundant

Results

We measured everything before and after. The dashboard wasn't just faster — it changed how advisors worked every day.

−82s

Time to find a client record, down from 94s to 12s.

−82s

Time to find a client record, down from 94s to 12s.

+67%

Compliance deadline visibility before issues escalate.

+67%

Compliance deadline visibility before issues escalate.

−44%

Navigation support tickets in the first quarter post-launch.

−44%

Navigation support tickets in the first quarter post-launch.

+28%

Daily active dashboard usage as a working tool.

+28%

Daily active dashboard usage as a working tool.

Before / After

The checkout had grown organically over 3 years. Six steps, 23 form fields, two forced account walls. Users weren't confused — they were exhausted. Session recordings showed a slow bleed across every step, with the sharpest drop-off right after shipping details, when users first saw how many steps remained.

Before

After

Process

Eight weeks, four phases, one core question: why are people leaving right before they pay? I started by mapping every state of the existing flow, talked to real users who had abandoned checkouts, explored three design directions, and tested them before committing to anything. The result shipped in week 7.

1

Discover

Audited the full flow — every state, error, and edge case. Reviewed session recordings and heatmaps to find where users were actually leaving.

Research

1

Discover

Audited the full flow — every state, error, and edge case. Reviewed session recordings and heatmaps to find where users were actually leaving.

Research

2

Define

Ran 5 user interviews with people who had abandoned a checkout recently. Core insight: users weren't confused — they were exhausted by perceived length.

Insight

2

Define

Ran 5 user interviews with people who had abandoned a checkout recently. Core insight: users weren't confused — they were exhausted by perceived length.

Insight

3

Design

Explored 3 directions — single page, aggressive reduction, and a stepped flow with smarter progress. Built prototypes for each and prepared them for testing.

Design

3

Design

Explored 3 directions — single page, aggressive reduction, and a stepped flow with smarter progress. Built prototypes for each and prepared them for testing.

Design

4

Validate

Tested all 3 directions with 8 participants via Maze. Direction 3 won. Nobody noticed the progress bar change — they just moved faster. Shipped in week 7.

Testing

4

Validate

Tested all 3 directions with 8 participants via Maze. Direction 3 won. Nobody noticed the progress bar change — they just moved faster. Shipped in week 7.

Testing

Solution

The core insight was that users couldn't see the end from where they were standing. The fix was architectural — collapse six steps into three, make the order always visible, and move account creation to after purchase.

App screen - "Shipping details"
App screen - "Payment details"

Billing defaulted to match shipping, removing 9 redundant fields instantly. A sticky order summary kept users anchored to what they were buying. A percentage-based progress indicator replaced "Step 2 of 6" — users moved faster without noticing why.

App screen - "Almost there"

Billing defaulted to match shipping, removing 9 redundant fields instantly. A sticky order summary kept users anchored to what they were buying. A percentage-based progress indicator replaced "Step 2 of 6" — users moved faster without noticing why.

CEO, Cartly

"The checkout redesign gave us the biggest single conversion lift we've ever seen. Alex just gets it."

Two app screens - Onboarding

+34%

Ranked financial app in Georgia by total downloads (2025-2026).

+34%

Ranked financial app in Georgia by total downloads (2025-2026).

+42%

Mobile conversion — sticky order summary had outsized impact

+42%

Mobile conversion — sticky order summary had outsized impact

−85s

Average time to complete, down from 4m 20s to 2m 55s

−85s

Average time to complete, down from 4m 20s to 2m 55s

+42%

Mobile conversion — sticky order summary had outsized impact

+42%

Mobile conversion — sticky order summary had outsized impact

  • 84% of site visitors arrived on mobile, so the gate had to work one-handed, mid-drop.
  • The ticket selector was the most-visited page on the entire site, so whatever happened there decided the sale.
  • The access code was the customer service number on the back of a Sapphire card. Nobody knows that by heart, so the code step had to explain itself.
Success screen for app

Takeaways

Friction is emotional, not just functional

Users weren't dropping off because checkout was hard. They abandoned because it felt long before they even started.

Remove the force, increase the choice

Moving account creation post-purchase didn't just reduce abandonment — it actually increased sign-ups from 11% to 18%.

Visibility is a trust mechanism

A persistent order summary was the highest-ROI single component — one element contributed to nearly half the mobile conversion lift.